Showing posts with label Bitcoin Price Charts. Show all posts

Tuesday, July 12, 2016

Bitcoin Price Charts - July 2016, 3 Days After Block Reward Halving

The Bitcoin price has been in a sideways squeeze for a few weeks now, trading in a comparatively tight range.  With the hype over the block reward halving dying down, we may be set for a move in the Bitcoin price.  Here are the current 10-day and 5-day Bitcoin price charts along with the usual technical indicators and my own markups for support and resistance levels.  It looks like we could see a minor bounce upward in the week ahead, although overhead resistance is not far from the current support level (and they are converging quickly).

The 10-day chart does show a few good bullish signs, including a shift in the support slope, moving average crossover and improvement, and two recoveries after breaking support.  Also, StochRSI (an indicator of relative strength) shows that the market is likely oversold in the short-term which could mean the price will move upward to test resistance levels.

This week is tough to gauge as there is no definite trading pattern that I see and the price is still just kinda bouncing sideways.  So please look the charts over and form your own opinion.  My recommendation for this week... watch the support and resistance levels, look for the price to test upper resistance, and otherwise sit on the sidelines and wait for the market to decide where it's going.

Charts courtesy of http://bitcoincharts.com with my own personal additions.  License info below.

5-Day Bitcoin Price Chart, 1 Hour Intervals


 10-Day Bitcoin Price Chart, 2 Hour Intervals


https://creativecommons.org/licenses/by-sa/3.0/
These charts (with my additions) are licensed under a
Creative Commons Attribution-ShareAlike 3.0 Unported License

Please link back to me and BitcoinCharts.com if you use them.  Thanks!

Tuesday, July 5, 2016

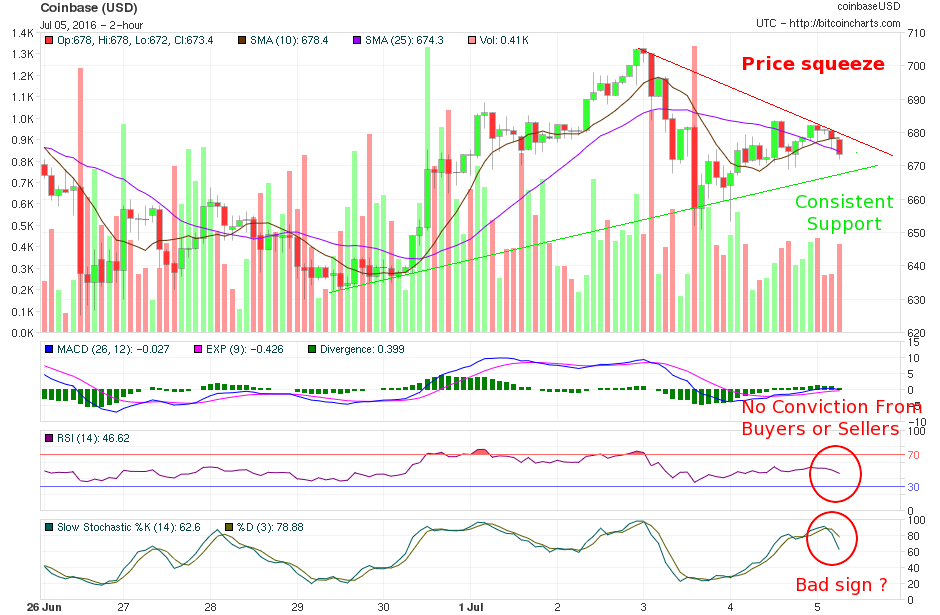
Bitcoin Price Charts - 5 Days Before Reward Halving

With most of us groggily heading back to work after a long weekend of celebrating America's independence, it's anybody's guess what may or may not happen in the Bitcoin markets in the week ahead.  Tuesday may be a bog of indecision as we fight relentless hangovers and struggle to get back to "the daily grind".  Or tomorrow may prove explosive, the Markets never seem to leave any possibility out.

According to BitcoinBlockHalf.com, we have just under 5 days until the dreaded "Bitcoin Halving" occurs.  That is, the reward for successfully generating a new block will be cut in half from 25 Bitcoins to 12.5 Bitcoins per block once another ~600 new blocks are generated.  The estimated date of the reward halving is July 9th, 10:50 AM Eastern time, but this will change depending on how quickly the next six hundred blocks get mined.

Sometimes it'd be wonderful (and profitable) to see the future: Where's Marty McFly and the Doc when you need them?  Unfortunately, nobody knows for sure what's going to happen to the price of Bitcoin leading up to (and after) the reward halving.  But to help you make an informed decision, I've generated a few prices charts and posted them below.  It's interesting to note the similarities and differences between the 2-day, 5-day, and 10-day charts, showing possible trends in the coming hours and days.


Charts courtesy of http://bitcoincharts.com with my own personal additions.  License info below.

2-Day Bitcoin Price Chart, 30-Minute Intervals


5-Day Bitcoin Price Chart, 1 Hour Intervals

 10-Day Bitcoin Price Chart, 2 Hour Intervals


https://creativecommons.org/licenses/by-sa/3.0/
These charts (with my additions) are licensed under a
Creative Commons Attribution-ShareAlike 3.0 Unported License

Please link back to me and BitcoinCharts.com if you use them.  Thanks!

Thursday, June 30, 2016

Bitcoin Price Chart w/Technical Indicators - June 2016

With about 3 weeks left before Bitcoin block rewards are cut in half, the price of Bitcoin is slowly getting squeezed into a wedge, possibly forcing something big (up or down) in the near future.

If you've followed crypto-currencies for any length of time, you already know the Bitcoin community has been livid over the decreasing block rewards for months now, even before last Christmas.  The community as a whole has been scrambling to mine and hoard as many Bitcoin as possible leading up to the halving a few weeks from now.

This hoarding has helped drive the price of Bitcoin upwards from ~$350-450 levels, more than doubling the price until the recent pullback to the $650 range.

What happens next is anybody's guess.  I personally thought the hype alone would keep pushing the price higher, longer but it seems the calm before the storm is already here.

The question on my mind now is this: Which side will have the most influence on the BTC price in the coming weeks... The hype surrounding the pending reward halving and scramble to gather more Bitcoin?  Or those on the sidelines who have been collecting Bitcoin for months now and will be looking to cash in (and possibly hammer the price) in the near future?  I guess we'll find out soon enough.

In the meantime, here's a current Bitcoin price chart for the past 30 days, along with my own markups to show approximate support and resistance levels and a few useful technical indicators.

Chart courtesy of http://bitcoincharts.com with my own personal additions

https://creativecommons.org/licenses/by-sa/3.0/

One thing to keep in mind when looking at price charts is your investment time frame.   The chart above doesn't do you much good if you're a day trader.  On the same lines, the 6-month chart looks quite a bit different (with it's own set of buy/sell indicators), as does the 10-day, 5-day, hourly charts, etc.

Bookmark this site and check back often as more charts, indicators, and analysis will be posted shortly.


References: