Showing posts with label Bitcoin price. Show all posts

Monday, July 18, 2016

Bitcoin 10-Day Price Chart - BULLISH Pattern for July 18th, 2016

Current BTC Price as of this writing:  $675.77 USD (Coinbase.com)

I just ran a 10-day Bitcoin price chart and am happy to see a nice bullish pattern emerge with the STRONG POSSIBILITY of a PRICE INCREASE over the next 24-36 hours.

As long as the support level holds, it appears as though upper resistance will be tested again, meaning the price could pop up to the $685-$690 range.

The relative strength is right where it needs to be for such a move to occur, and the slow stochastic just had a bullish crossover (I've pointed out the previous three crossovers in blue and tagged a vertical line through the approximate price at each crossover.  From the chart below, you can see exactly what happen after these crossovers occur (the price moves up).

Nothing in trading or investing is guaranteed, so I urge you to do your own research before risking anything, but by the same token, let's hope this latest crossover will repeat the upward trend.


Chart courtesy of http://bitcoincharts.com.
Additions are my own and released under the same license as the chart.  Info below.

 10-Day Bitcoin Price Chart, 2 Hour Intervals


https://creativecommons.org/licenses/by-sa/3.0/
This chart (with my additions) is licensed under a
Creative Commons Attribution-ShareAlike 3.0 Unported License

Please link back to me and BitcoinCharts.com if you use it.  Thanks!

References:

Tuesday, July 12, 2016

Bitcoin Price Charts - July 2016, 3 Days After Block Reward Halving

The Bitcoin price has been in a sideways squeeze for a few weeks now, trading in a comparatively tight range.  With the hype over the block reward halving dying down, we may be set for a move in the Bitcoin price.  Here are the current 10-day and 5-day Bitcoin price charts along with the usual technical indicators and my own markups for support and resistance levels.  It looks like we could see a minor bounce upward in the week ahead, although overhead resistance is not far from the current support level (and they are converging quickly).

The 10-day chart does show a few good bullish signs, including a shift in the support slope, moving average crossover and improvement, and two recoveries after breaking support.  Also, StochRSI (an indicator of relative strength) shows that the market is likely oversold in the short-term which could mean the price will move upward to test resistance levels.

This week is tough to gauge as there is no definite trading pattern that I see and the price is still just kinda bouncing sideways.  So please look the charts over and form your own opinion.  My recommendation for this week... watch the support and resistance levels, look for the price to test upper resistance, and otherwise sit on the sidelines and wait for the market to decide where it's going.

Charts courtesy of http://bitcoincharts.com with my own personal additions.  License info below.

5-Day Bitcoin Price Chart, 1 Hour Intervals


 10-Day Bitcoin Price Chart, 2 Hour Intervals


https://creativecommons.org/licenses/by-sa/3.0/
These charts (with my additions) are licensed under a
Creative Commons Attribution-ShareAlike 3.0 Unported License

Please link back to me and BitcoinCharts.com if you use them.  Thanks!

Monday, July 11, 2016

Bitcoin Mining Reward Cut in Half – July 9th, 2016 – What this Means for Bitcoin's Future

The virtual currency Bitcoin hit another milestone a couple days ago when the reward for generating new Bitcoins was cut in half. Previously, when a new block was generated, the miner (or mining pool) responsible for generating the new block was awarded 25 Bitcoins for the efforts. Now with the reward halving come and gone, the same amount of effort produces only half the rewards, 12.5 Bitcoins (it actually takes more effort now as the difficulty for solving a block increased at the same time the reward decreased).

All of this and the Bitcoin price remains relatively flat, trading around $650 USD per Bitcoin as of this writing.

Many expected the price of Bitcoin to double when the reward was cut in half, and in many aspects, this makes a lot of sense. After all, the electricity cost and maintenance/upkeep of mining equipment hasn't changed – it still costs roughly the same to generate a new Bitcoin block, but since the reward is less, the price should be more to compensate, right? Well, maybe, maybe not.

Let's rewind to the end of last year when talk of the Summer 2016 Bitcoin halving first started hitting a fever pitch. At the time, Bitcoin was trading at $300-350 each and mining enthusiasts were snatching up and setting up Bitmain's Antminer S7 just as fast as they could.
Since then, the price HAS doubled. And for the last several weeks the price of Bitcoin seems stuck at approximately double the price of Q3-Q4 just last year.

So has the doubling in price already happened and we just missed it because it was slow and gradual and happened over months instead of overnight? Or is the price increase of the previous months just a glimpse of what is to come? At this point it is still too early to say, and the Bitcoin markets appear indecisive with most traders still sitting on the sidelines.

As mentioned in my previous posts, the Bitcoin price is being squeezed sideways. It'll move up a little or down a little, there's some panic selling here and some fickle buying efforts there, but overall the price is just kinda bouncing along in a sideways trading range with signs of trepidation and indecision. I don't know what the market is doing and I don't think it knows yet either. Hopefully a better trading pattern will emerge soon.


Is Now a Good Time to Invest in Bitcoin?
One recurring theme that has been popping up along with the reward halving chatter, is whether or not now is a good time to buy and/or invest in Bitcoin. Those bullish on Bitcoin say that it is now more rare than ever and more difficult to earn new Bitcoins. Those who are bearish on Bitcoin say the market is in a bubble, is too fickle/volatile, and that whales are waiting to dump their Bitcoin hoards and beat the price down.

Both Bitcoin bears and bulls have valid arguments, but the Bitcoin markets and price are on the fence so until that changes, I'm on the fence and undecided as well.


Points to Consider Before Buying or Selling Bitcoin in Today's Market
Before dumping your life savings into Bitcoin or trading your hard earned coins for cash, here are a few points to consider:

  • In the last several years, the price of Bitcoin has been much higher than it is today, with a stretch of time in the $1,000+ range.
  • In the last several years, the price of Bitcoin has been much lower than it is today, substantially lower. The market is volatile, offering high risks and high rewards. Don't invest more in Bitcoin than you can afford to lose.
  • With recent events, Bitcoin markets remain undecided in a sideways holding pattern. Indecisive markets can mean big swings up or down... Making an investment decision right now means significantly higher risks, but also potentially huge rewards.
  • It will take time for the full effects of the reward halving to be felt. New blocks (and Bitcoins) are generated approximately every 10 minutes while maintenance and electricity bills are usually paid on a bi-monthly or monthly basis.
  • If the Bitcoin price doesn't go up soon, entire hordes of mining equipment will either be operating at a loss or taken offline due to an inability to run profitably. This would lead to a DECREASE in the difficulty of generating a new Bitcoin block, or at least keep the difficulty relatively flat for one or more adjustment periods.
  • Antminer recently released their newest SHA-256 ASIC miner, the S9. This miner offers a huge leap in efficiency and mining power and is being unleashed in bulk on the mining community. As more S9's come online (as well as next gen miners from other companies), more Bitcoins will be generated quicker until the difficulty rises to slow them down. Yet another factor playing on the Bitcoin price.


At this point it's tough to say exactly what will happen with Bitcoin's future but one thing's for certain, Bitcoin use is increasing worldwide and it isn't going anywhere anytime soon.

Tuesday, July 5, 2016

Bitcoin Price Charts - 5 Days Before Reward Halving

With most of us groggily heading back to work after a long weekend of celebrating America's independence, it's anybody's guess what may or may not happen in the Bitcoin markets in the week ahead.  Tuesday may be a bog of indecision as we fight relentless hangovers and struggle to get back to "the daily grind".  Or tomorrow may prove explosive, the Markets never seem to leave any possibility out.

According to BitcoinBlockHalf.com, we have just under 5 days until the dreaded "Bitcoin Halving" occurs.  That is, the reward for successfully generating a new block will be cut in half from 25 Bitcoins to 12.5 Bitcoins per block once another ~600 new blocks are generated.  The estimated date of the reward halving is July 9th, 10:50 AM Eastern time, but this will change depending on how quickly the next six hundred blocks get mined.

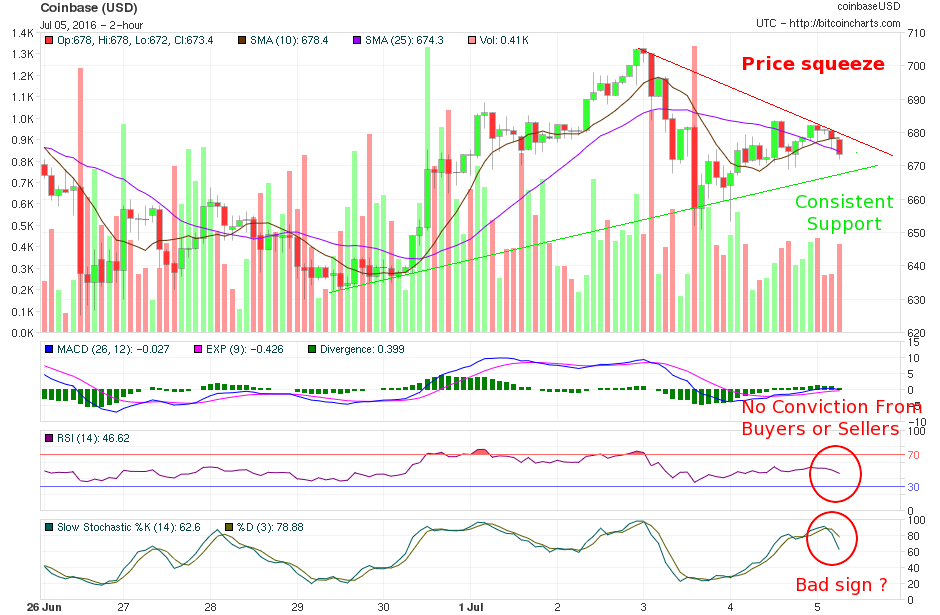
Sometimes it'd be wonderful (and profitable) to see the future: Where's Marty McFly and the Doc when you need them?  Unfortunately, nobody knows for sure what's going to happen to the price of Bitcoin leading up to (and after) the reward halving.  But to help you make an informed decision, I've generated a few prices charts and posted them below.  It's interesting to note the similarities and differences between the 2-day, 5-day, and 10-day charts, showing possible trends in the coming hours and days.


Charts courtesy of http://bitcoincharts.com with my own personal additions.  License info below.

2-Day Bitcoin Price Chart, 30-Minute Intervals


5-Day Bitcoin Price Chart, 1 Hour Intervals

 10-Day Bitcoin Price Chart, 2 Hour Intervals


https://creativecommons.org/licenses/by-sa/3.0/
These charts (with my additions) are licensed under a
Creative Commons Attribution-ShareAlike 3.0 Unported License

Please link back to me and BitcoinCharts.com if you use them.  Thanks!

Thursday, June 30, 2016

Bitcoin Price Chart w/Technical Indicators - June 2016

With about 3 weeks left before Bitcoin block rewards are cut in half, the price of Bitcoin is slowly getting squeezed into a wedge, possibly forcing something big (up or down) in the near future.

If you've followed crypto-currencies for any length of time, you already know the Bitcoin community has been livid over the decreasing block rewards for months now, even before last Christmas.  The community as a whole has been scrambling to mine and hoard as many Bitcoin as possible leading up to the halving a few weeks from now.

This hoarding has helped drive the price of Bitcoin upwards from ~$350-450 levels, more than doubling the price until the recent pullback to the $650 range.

What happens next is anybody's guess.  I personally thought the hype alone would keep pushing the price higher, longer but it seems the calm before the storm is already here.

The question on my mind now is this: Which side will have the most influence on the BTC price in the coming weeks... The hype surrounding the pending reward halving and scramble to gather more Bitcoin?  Or those on the sidelines who have been collecting Bitcoin for months now and will be looking to cash in (and possibly hammer the price) in the near future?  I guess we'll find out soon enough.

In the meantime, here's a current Bitcoin price chart for the past 30 days, along with my own markups to show approximate support and resistance levels and a few useful technical indicators.

Chart courtesy of http://bitcoincharts.com with my own personal additions

https://creativecommons.org/licenses/by-sa/3.0/

One thing to keep in mind when looking at price charts is your investment time frame.   The chart above doesn't do you much good if you're a day trader.  On the same lines, the 6-month chart looks quite a bit different (with it's own set of buy/sell indicators), as does the 10-day, 5-day, hourly charts, etc.

Bookmark this site and check back often as more charts, indicators, and analysis will be posted shortly.


References: